


What Is Lorenz Curve? Essential Things To Know About It

Lorenz curve forms an essential part of business development. American economist Max Lorenz gave this concept in 1905. This offers a graphical representation highlighting the facts of why there exists an income or wealth inequality.
The graph of the Lorenz curve plots the income or percentiles on the horizontal axis. On the other hand, it plots cumulative income as well as wealth on the vertical axis. You need to know this fact before making any choices.
The main function of this curve is to measure the income inequality among a certain group of the population. You need to get through the concepts to have a better insight into it. At the time of calculating progressive taxation, this curve plays a vital role.
What Is Lorenz Curve?

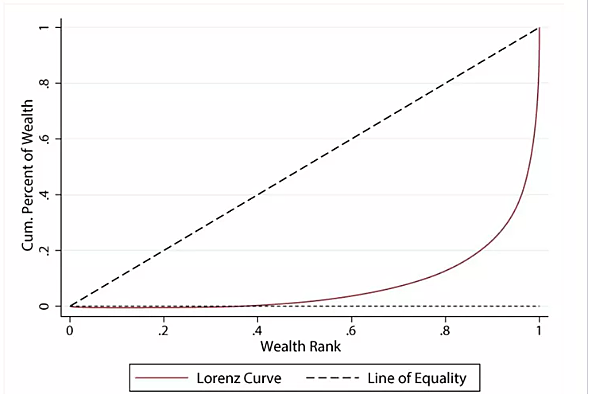
The Lorenz curve is a graphical representation used in economics to illustrate income or wealth distribution within a population. It’s named after Max O. Lorenz, an American economist who developed it in 1905. This curve compares the actual distribution of a specific variable, such as income, to a perfectly equal distribution.
Economists use the Lorenz curve to calculate a summary measure of income or wealth inequality called the Gini coefficient. This coefficient quantifies the extent of inequality in a distribution: a value of 0 represents perfect equality, while a value of 1 (or 100%) indicates extreme inequality, where one individual holds all the wealth or income.
Lorenz Curve Formula
You have to follow the accurate formula for making the calculation of income distribution among the population regarding income distribution. People’s distribution of income level can be easily calculated using the Lorenz Curve.

How to Construct a Lorenz Curve
In this section, I will discuss how you can construct a Lorenz Curve.
- First, you must start by sorting the population by income in an ascending order.
- After that, you can calculate the cumulative percentage of the overall population.
- Next, you have to calculate the cumulative percentage of the total income value.
- Once you are done, you can plot the cumulative percentage value of the population on the x-axis. Similarly, you must plot the cumulative percentage of the total income on the y-axis.
- Lastly, finish the curve by connecting the plotted points in order to form the lorenz curve.
Wait! You can also do the same by using Excel to create a Lorenz curve. Here are some of the steps that you must follow:
- You can start by inserting a scatter plot with some data points that are connected by a smooth line.
- After that, you must format the axes to the end of 100.
- Then, you must label the axes and add a chart title.
- Label the legend line as well.
Lastly, add the equality line to the chart.
Essential Components Of Lorenz Curve
There are several essential components of the Lorenz curve. You must know about it to have a better idea of it. Some of its core important components are as follows:-
1. Population
The entire group of the population analysis is done in terms of income or wealth distribution.
2. Cumulative Percentage Of Population
The x-axis of the graph represents the cumulative percentage of the population, usually ranked from the poorest to the richest.
3. Cumulative Percentage Of Income & Wealth
The y-axis represents the cumulative percentage of total income or wealth held by the population up to that point. It ensures a compound annual growth rate.
4. Perfect Equality Line
This is a diagonal line representing perfect equality in income or wealth distribution. Here each segment of the population holds an equal percentage of income or wealth. This line is a 45-degree line from the origin. You can apply the 50,30 20 rule here.
5. Lorenz Curve Line
The actual curve drawn on the graph shows the distribution of income or wealth in reality. It illustrates how the cumulative percentage of income or wealth held by the corresponding cumulative percentage of the population differs from perfect equality.
6. Gini Coefficient
While not directly part of the Lorenz curve, it’s often calculated from this curve. It’s a numerical measure of income or wealth inequality. The Gini coefficient ranges from 0 (perfect equality) to 1 (maximum inequality).
Pros & Cons Of Lorenz Curve
There are several pros and cons of the Lorenz curve. You must be well aware of it before making the calculation of the distribution of the population. Try to implement the correct process to get the maximum output from it.
Pros Of Lorenz Curve
There are several pros of the Lorenz curve. You must know about it before you make use of this Lorenz curve. It will make things easier for you.
1. Visual Representation
It offers a clear visual representation of income or wealth distribution, making it easy to comprehend and compare different distributions.
2. Comparison Tool
It enables comparisons between various distributions, highlighting disparities and changes in inequality over time or across different groups or regions.
3. Gini Coefficient
The Lorenz curve facilitates the calculation of the Gini coefficient. A single number summarizes the degree of inequality, allowing for quantitative comparison between distributions.
4. Policy Insights
It provides policymakers and economists with insights into the level of income or wealth inequality within a population. Aiding in the formulation of policies aimed at addressing disparities. Similar kinds of concepts are there in Investopedia.
Cons Of Lorenz Curve
Along with the Pros, there are several cons as well. You must be well aware of this fact while attaining your requirements with ease.
1. Simplification Of Reality
It simplifies complex distributions into a single curve, potentially oversimplifying the nuances and variations within a population’s distribution.
2. Data Requirements
Constructing an accurate Lorenz curve requires precise data on income or wealth distribution. It might not always be readily available or accurate.
3. Does Not Focus On All Aspects
It focuses solely on income or wealth and doesn’t consider other factors like access to education, healthcare, or social mobility. These are also crucial components of inequality.
4. Interpretation Of Challenges
Interpreting this curve requires understanding its graphical representation and the implications of the Gini coefficient. It can sometimes be misunderstood or misinterpreted.
Importance Of Lorenz Curve
There are several importance of the Lorenz curve. You must be well aware of it while attaining your requirements with complete ease. Some of the core importance of it are as follows:-
- This curve is vital for policymakers, economists, and social scientists to gauge the fairness and inclusivity of an economy.
- It helps in designing targeted interventions and social programs to reduce disparities and promote a more equitable society.
- The curve facilitates comparisons between different groups, regions, or countries, allowing for an assessment of disparities on various scales.
- This coefficient curve allows for quantification and comparison of inequality levels across different populations or time periods.
- It helps maintain social cohesion and stability.
- Assists economists and policymakers in understanding how inequality might affect economic development, productivity, and overall societal well-being.
Who Uses Lorenz Curve?
You may have doubt in your mind about who uses this curve. The simple answer to this question is, in most cases, the following types of people make use of the Lorenz curve.
- Economists
- Social Scientists.
- Policy Makers.
- International Organizations.
- Non-Governmental organizations.
These types of people make use of the Lorenz Curve. You need to stay well aware of it before making use of this curve at your end.
Applications of the Lorenz Curve
As you have learned, the Lorenz curve is famous for being a graphical presentation that shows how income or wealth is being distributed across a population. The curve can be applied in various ways, which include:
- Economic analysis
- Identifying the areas for the policy intervention
- Analyzing the income mobility
- Evaluating the economic policies
- Academic research
- Business modelling
- Epidemiology and Public Health
Strengths and Limitations of Lorenz Curve
The Lorenz curve comes with both strengths and weaknesses. This includes:
|
Strengths |
|
|
Anonymity |
The Lorenz curve is able to display various sensitive financial information. So, it allows you to maintain the anonymity of the individual survey. |
|
Policy change |
The Lorenz curve can be layered on top of itself over time. This helps to show how much the policy has changed that inequality. |
|
Weaknesses |
|
|
Data quality |
Usually, the accuracy of the Lorenz curve is highly dependent on reliable data based on individual income. However, it can be challenging to collect precise information about everyone’s earnings. |
|
Focusing on monetary inequality |
The curve mainly focuses on monetary inequality. It does not account for any other form of inequality. This includes education, healthcare, etc. |
|
Sample size |
The entire Lorenz Curve is totally based on the sample income. This way, it does not capture the proper distribution of any other income in society. |
|
Linear relationship |
The Lorenz curve also assumes and very linear relationship between income and better well-being. However, this may not always be the case. |
|
Time |
This curve only shows the current level of income inequality. However, it fails to show how much it has changed over time. |
Real-Life Examples Of Lorenz Curve
Here are some real-life examples of how Lorenz Curve helps us better understand income inequality:
- Income Distribution in Countries. Governments use the Lorenz Curve to study how income is spread in a country. For example, the curve for countries like the U.S. or Brazil shows that a small percentage of people have most of the wealth, which means there is a lot of inequality.
- Corporate Salaries. It will also show the distribution of salaries in an organization. A lot of it will go to the cream-of-the-crop top leaders if the curve appears heavily imbalanced.
- The Lorenz Curve can be used to explain how the wealth is distributed between the families. In most developing countries, the wealth is spread in a minimal number of families.
- Land Ownership Where land is not distributed equally, the Lorenz Curve will show that a few people have significant land while many others own relatively tiny portions of land.
In all these cases, the Lorenz Curve helps to show differences in wealth.
Final Take Away
Hence, if you want to make use of the Lorenz curve, then you must be well aware of it. Without having a piece of proper information about it, you cannot make your choices in the correct direction. Try to figure out the perfect choices that can make things easier for you.
You can share your views and comments in our comment section. It can assist you in getting your requirements with complete ease. Try out the best solution that can make things easier for you in the long run.
Continue Reading:


Leave A Reply